It seemed that 2019 went by extremely fast and we’re already into the new year. That means that we can now take a look back at some of the statistics and other things that happened on The Brick Fan last year. This is probably one of my favorite times of the year simply because I like to see how my numbers stack up to previous years and also assess what I can do to improve.
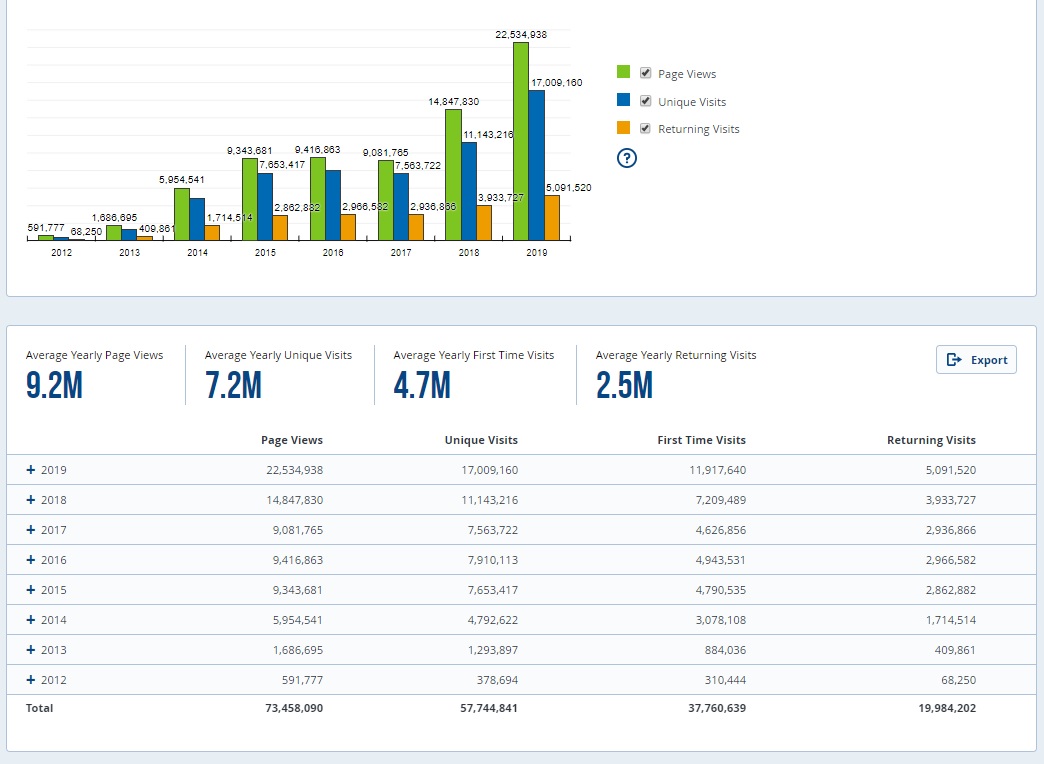
We ended the year with 22,534,938 page views which is 51% more than in 2018. I’m not sure why the massive increase but I’ll gladly take it. As a result, unique views and first time visitors also dramatically increased as well.
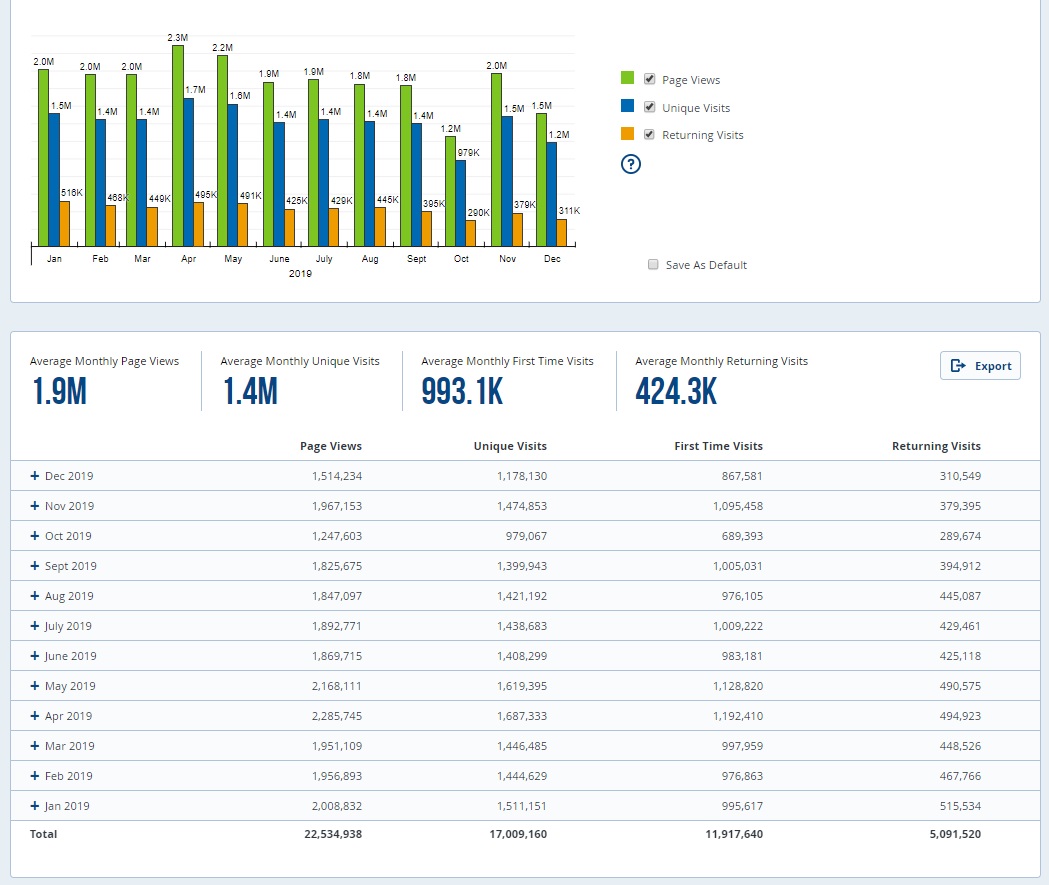
One thing that is curious is that October’s traffic dropped a lot and I’m not sure why. There were 87 posts during the month which is on par compared to the other months of the year.
Our biggest traffic day was on November 19 with 121,434 page views. This was during the time when images of the 2020 sets started surfacing online. We finished off the year with 932 posts which is a bit more than previous years.
On to social media counts, we’re still slowly growing on Facebook, Twitter, and Instagram. Facebook now has 15,845 followers (11% increase), Twitter has 9,513 followers (18% increase), and Instagram has 15,254 followers (16% increase). The subreddit now currently has 404 readers subscribed. No that is not a page error for you programmers.
Last year was pretty successful in my … Continue