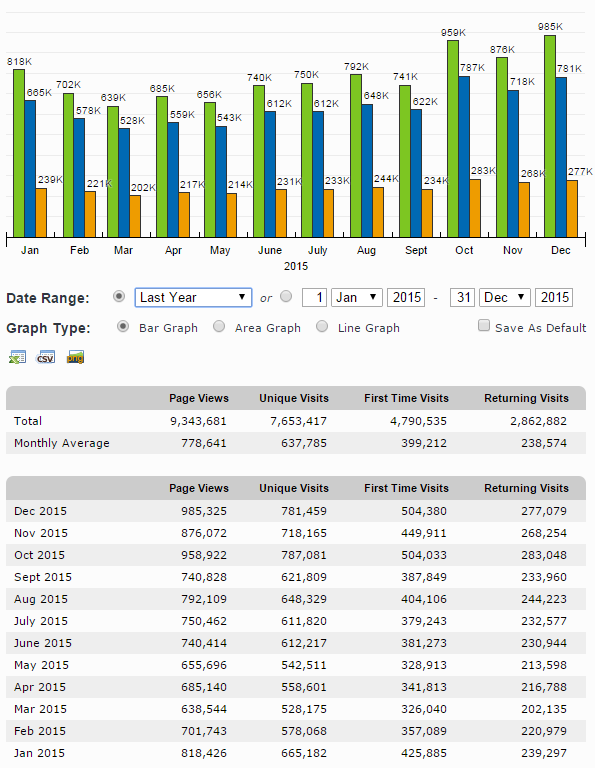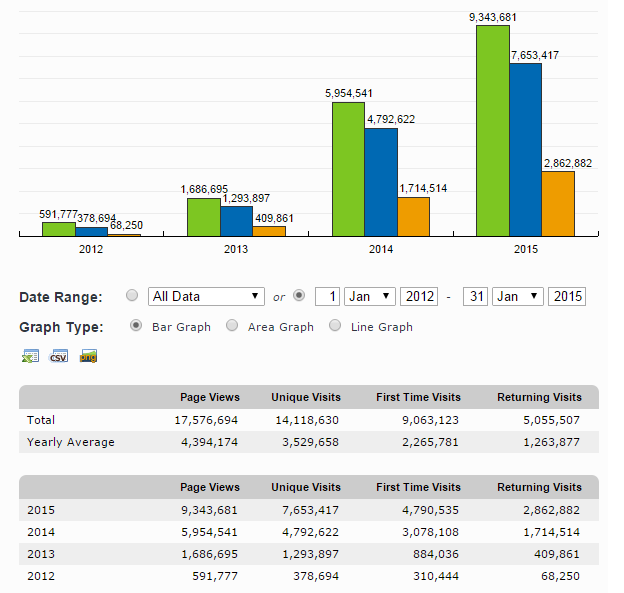
Well 2015 is in the books and it was another successful year on The Brick Fan so let’s take a look at what happened last year. Prepare to be inundated with statistics so let’s do a little recap of some of the numbers for the site last year. As you can see from the graph below, we saw another increase in traffic last year which went up for about 60% compared to the 2014. Subsequently, other metrics increased accordingly including first-time visitors which went up 56% while returning visitors went up 70%.

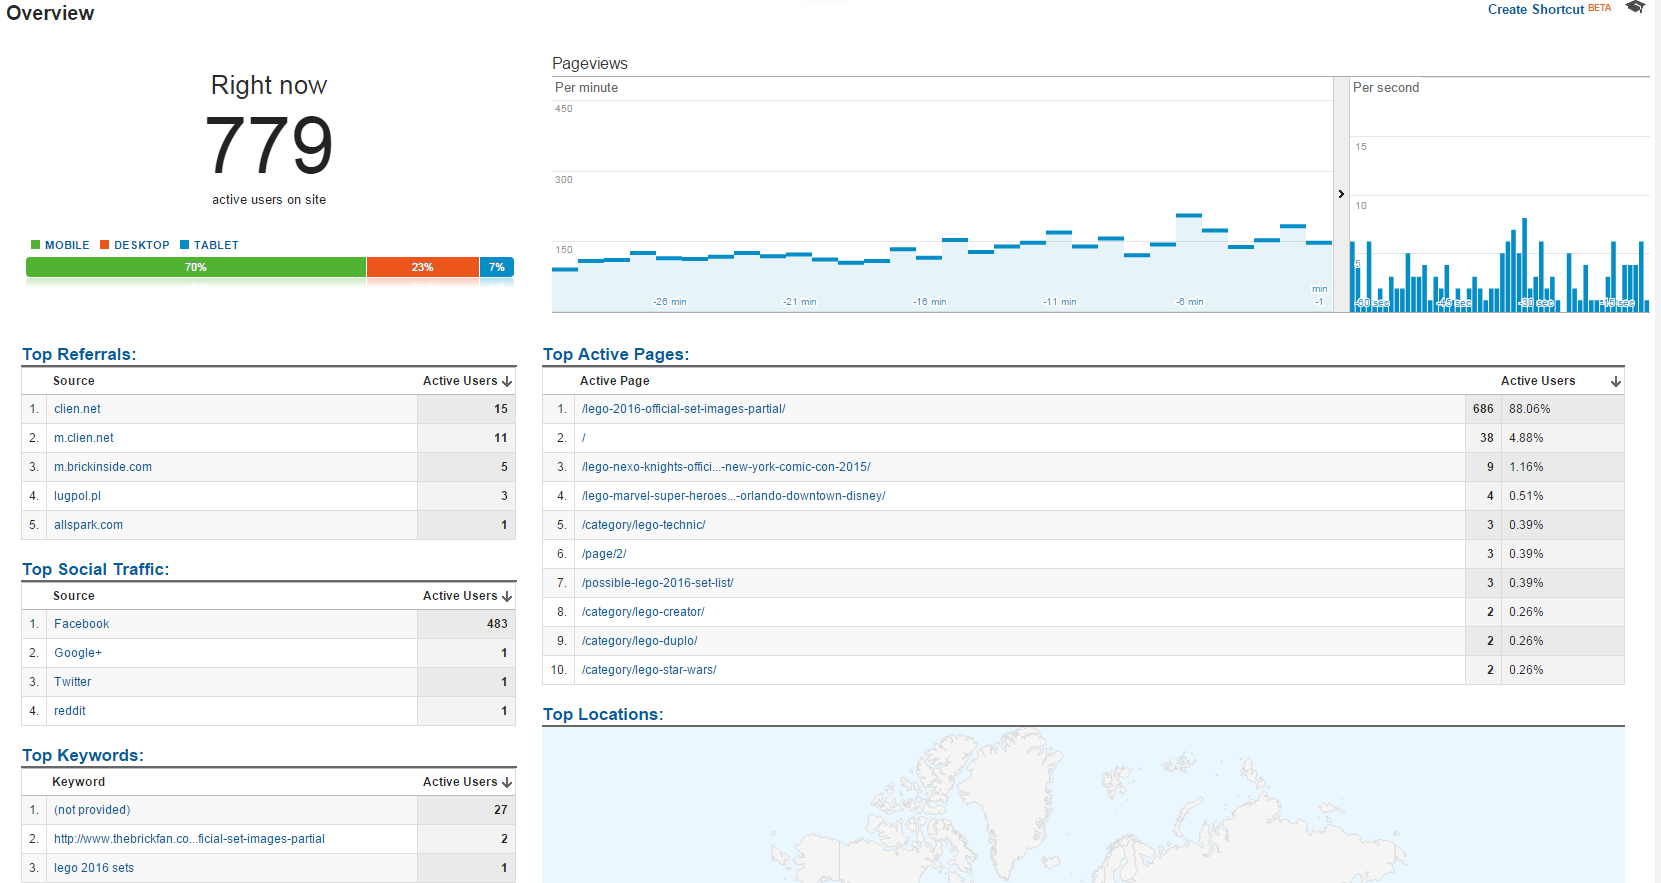
There were also some traffic milestones that were achieved in 2015. We finished the year with 17.5 million page views with October 11 being the highest recorded traffic day with 105,085 page views with a majority of it being for the official 2016 images post. That day also gave the most of active number of users on the site with 779. Unless somehow a post goes viral, I doubt that I’ll see a number that high anytime soon. Finally, we ended the year with December being the most visited month of 2015.


In regards to our social media sites, the Facebook Page went from 4,137 in 2014 to 7,513 at the end of 2015.
Over on Twitter, there were 1,526 new followers in 2015 and we ended the year with 5,379.
Finally on Google+, we ended 2015 with 1,856 followers which was a sharp increase from 516 in the beginning of the year.


